
Unit 5 Graphs and Tables in Nemeth Code
Graphs and tables are used to organize information to show patterns and spatial relationship of data. The information can be represented spatially in braille as well.
Tally Marks
One tally mark is represented by a vertical line (dots 4-5-6). The fifth tally mark is not placed horizontally across the previous four tally marks as in print. Instead each group of five tally marks is separated by one space.
| Vertical line | ⠸ |
Example:
|||| |||| ||
⠸⠸⠸⠸⠸⠀⠸⠸⠸⠸⠸⠀⠸⠸
Number Line
Left arrow and right arrow marks are placed on either end of the axis line. Scale marks spaced at even intervals are represented by the letter "r" along the axis. Numbers written without the numeric indicator are spaced evenly directly under the scale marks and a full cell can be used to mark a point above the number line.
| Axis line | ⠒ |
| Left arrow | ⠪ |
| Right arrow | ⠕ |
| Scale mark | ⠗ |
| Solid point | ⠿ |
Example:

⠀⠀⠀⠀⠀⠀⠀⠀⠀⠀⠀⠀⠀⠀⠀⠀⠀⠀⠀⠀⠀⠿
⠪⠒⠒⠗⠒⠒⠗⠒⠒⠗⠒⠒⠗⠒⠒⠗⠒⠒⠗⠒⠒⠗⠒⠒⠗⠒⠒⠗⠒⠒⠗⠒⠒⠗⠒⠒⠕
⠀⠀⠤⠢⠀⠤⠲⠀⠤⠒⠀⠤⠆⠀⠤⠂⠀⠀⠴⠀⠀⠂⠀⠀⠆⠀⠀⠒⠀⠀⠲⠀⠀⠢
Pictograph
The heading is centered on the line above the pictograph followed by a blank line. The pictograph description (number that each picture represents) is justified left on the following line. A full width top box line is place under the description. Vertical labels are justified left and guide dots are used after labels when there are 3 or more spaces before the zero line of the graph. A full cell represents a whole unit and a half unit is represented by dots 1,2,3. Each picture is separated by one space. A full width bottom box line is placed directly under the pictograph.
Important Note: The extent to which Nemeth Code is used will be determined by the transcriber (see Unit 4). Therefore, Nemeth rules have been used where UEB transcription may also be appropriate.
| Whole Unit | ⠿ |
| Half Unit | ⠇ |
| Top Box Line | ⠶ |
| Bottom Box Line | ⠛ |
| Guide Dot | ⠐ |
Example:
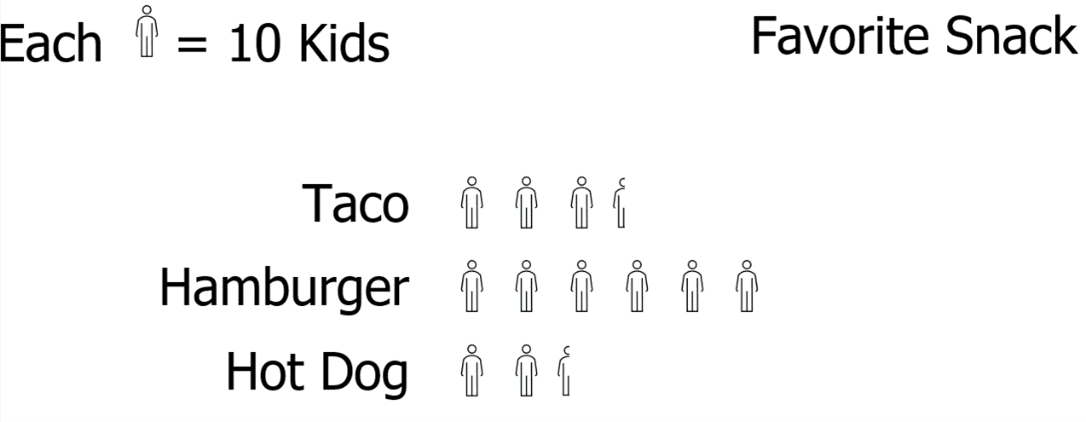
⠀⠀⠀⠀⠀⠀⠀⠀⠀⠀⠀⠠⠋⠁⠧⠕⠗⠊⠞⠑⠀⠠⠎⠝⠁⠉⠅
⠠⠑⠁⠡⠀⠿⠀⠨⠅⠀⠼⠂⠴⠀⠅⠊⠙⠎
⠶⠶⠶⠶⠶⠶⠶⠶⠶⠶⠶⠶⠶⠶⠶⠶⠶⠶⠶⠶⠶⠶⠶⠶⠶⠶⠶⠶⠶⠶⠶⠶⠶⠶⠶⠶⠶⠶⠶⠶
⠠⠞⠁⠉⠕⠀⠿⠀⠿⠀⠿⠀⠇
⠠⠓⠁⠍⠃⠥⠗⠛⠑⠗⠀⠿⠀⠿⠀⠿⠀⠿⠀⠿⠀⠿
⠠⠓⠕⠞⠀⠠⠙⠕⠛⠀⠀⠿⠀⠿⠀⠇
⠛⠛⠛⠛⠛⠛⠛⠛⠛⠛⠛⠛⠛⠛⠛⠛⠛⠛⠛⠛⠛⠛⠛⠛⠛⠛⠛⠛⠛⠛⠛⠛⠛⠛⠛⠛⠛⠛⠛
Boxed Material
Boxed material that is transcribed in Nemeth Code begins with an opening Nemeth indicator, space, and the top line. The code is terminated at the end of the bottom box line where a space is left between the line and the terminator.
| Top Box Line | ⠶ |
| Bottom Box Line | ⠛ |
| Open Nemeth Indicator (+ space) | ⠸⠩ |
| (Space +) Nemeth Terminator | ⠸⠱ |
Example:
| x | y |
| 2 | 6 |
| 3 | 9 |
| 4 |
⠸⠩⠀⠶⠶⠶⠶⠶⠶⠶⠶⠶⠶⠶⠶⠶⠶⠶⠶⠶⠶⠶⠶⠶⠶⠶⠶⠶⠶⠶⠶⠶⠶⠶⠶⠶
⠀⠀⠰⠭⠀⠀⠰⠽
⠀⠀⠐⠒⠀⠀⠐⠒
⠀⠀⠼⠆⠀⠀⠼⠖
⠀⠀⠼⠒⠀⠀⠼⠔
⠀⠀⠼⠲⠀⠀⠿
⠀⠀⠛⠛⠛⠛⠛⠛⠛⠛⠛⠛⠛⠛⠛⠛⠛⠛⠛⠛⠛⠛⠛⠛⠛⠛⠛⠛⠛⠛⠛⠛⠛⠛⠛⠀⠸⠱
Bar Graph
When a bar graph is transcribed in Nemeth Code, the heading is centered on the line above the graph followed by an empty line. Vertical labels are justified left and guide dots are used after labels when there are 3 or more spaces before the zero line of the graph. A full cell represents one unit and tick marks are placed under the bottom horizontal line at even intervals.
| Vertical line | ⠸ |
| Horizontal line | ⠐⠒ |
| Bar graph tick mark | ⠸ |
| Guide Dot | ⠐ |
Example:
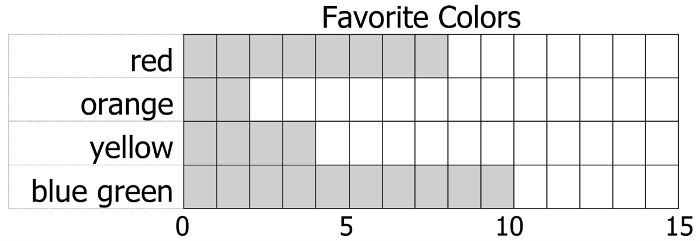
⠀⠀⠀⠀⠀⠀⠀⠀⠀⠀⠀⠀⠠⠋⠁⠧⠕⠗⠊⠞⠑⠀⠠⠉⠕⠇⠕⠗⠎
⠗⠑⠙⠀⠐⠐⠐⠐⠐⠐⠀⠸⠿⠿⠿⠿⠿⠿⠿⠿
⠕⠗⠁⠝⠛⠑⠀⠐⠐⠐⠀⠸⠿⠿
⠽⠑⠇⠇⠕⠺⠀⠐⠐⠐⠀⠸⠿⠿⠿⠿
⠃⠇⠥⠑⠀⠛⠗⠑⠑⠝⠀⠸⠿⠿⠿⠿⠿⠿⠿⠿⠿⠿
⠀⠀⠀⠀⠀⠀⠀⠀⠀⠀⠀⠐⠒⠒⠒⠒⠒⠒⠒⠒⠒⠒⠒⠒⠒⠒⠒
⠀⠀⠀⠀⠀⠀⠀⠀⠀⠀⠀⠸⠀⠀⠀⠀⠸⠀⠀⠀⠀⠸⠀⠀⠀⠀⠸
⠀⠀⠀⠀⠀⠀⠀⠀⠀⠀⠀⠼⠴⠀⠀⠀⠼⠢⠀⠀⠀⠼⠂⠴⠀⠀⠼⠂⠢